Problem statement
3D description of a hydrocarbon reservoir and its petrophysical and fluid properties is required for optimal, cost-effective administration of hydrocarbon reservoirs. Conventional methods for reservoir characterization are based on 3D continuous discretization of the subsurface hydrocarbon reservoir into volume pixels of various shapes. Fluid flow properties for each of the volume pixels are spatially interpolated from properties measured along well trajectories. Subsequently, the flow properties of all volume pixels are adjusted to iteratively match the time records of hydrocarbon production measurements with numerical simulations.
None of these methods however, use the concept of rock classes to interpolate fluid-flow properties of rocks between well trajectories. This can result in non-unique, non-feasible 3D description of reservoirs. Therefore, there is a need for better 3D description of petrophysical and fluid properties in a subsurface hydrocarbon reservoir.
All hydrocarbon-producing companies resort to such reservoir models to maximize their monetary yield over time. Therefore, any advancement in accuracy may result in significant increases in the final cash flow stemming from the initial investment.
Technology description
Researchers at The University of Texas at Austin have come up with a new method to match time records of hydrocarbon production measurements by first detecting common rock classes along existing well trajectories. Rock classes (flow units) and their fluid-flow properties are spatially interpolated between wells to match the time records of hydrocarbon production measurements with numerical simulations. Using rock classes (flow units) in a hierarchical manner to match the time records of fluid production measurements provides a more efficient, expedient, reliable and accurate procedure than with existing commercial methods.
Stage of development
Proof of concept. The method for detection and classification of rock classes has been tested with measurements acquired in several hydrocarbon producing fields. Figure 1 shows an example of such tests in a complex carbonate formation.
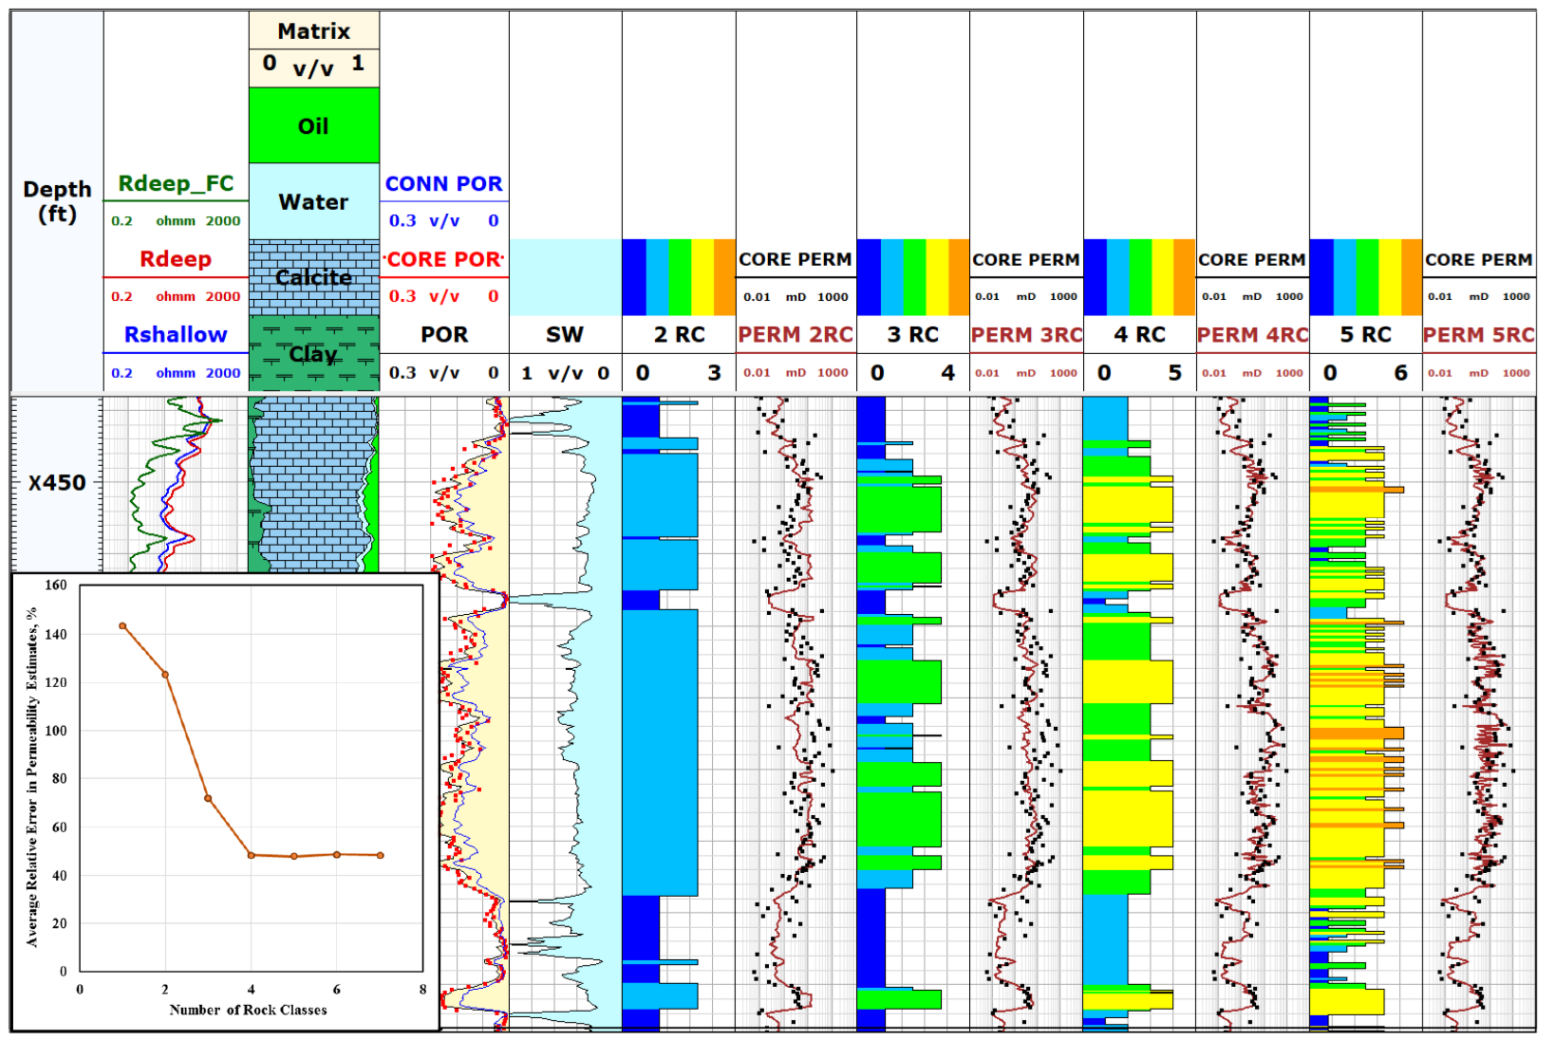
Figure 1: Comparison of the rock classification results at the number of rock classes ranging from 2 to 5
Track 1: depth
Track 2: fluid-corrected deep resistivity, deep resistivity, and shallow resistivity
Tracks 3-5: four volumetric concentration of minerals and fluid, connected porosity, total porosity, water saturation estimates, and core porosity measurements
Tracks 6-13: the rock classification results and the permeability estimates at each iteration, and the core permeability measurement. The average relative error in estimate of permeability decreases as the number of iterations increase to 4. The optimum number of flow units is estimated to be 4 in this carbonate formation.